The 10 Bay Area High Schools That Climbed the Most in UC Admit Rates Since 2019
Did you know? In 2019, Mission High School in San Francisco sent 166 kids to a UC. They had 605 seniors apply. That’s a 27% admit rate.
In 2025? Same school, same neighborhood, basically the same number of applicants: 327 admits out of 600. 55%. The admit rate doubled in six years.
We pulled the most recently published UC data on every Bay Area high school since 2019; Mission isn’t alone. There are ten Bay Area schools whose UC admit rates climbed by 25 points or more in 6 years, and the pattern says something important about what a UC actually rewards.
Here are the schools, ranked by how much their admit rates climbed:
The 10 Biggest Climbers, 2019 to 2025
| School | District | 2019 Rate | 2025 Rate | Change |
|---|---|---|---|---|
| MetWest High Oakland | Oakland Unified | 5% | 43% | +38 pts |
| Arise High Oakland | Oakland Unified | 9% | 40% | +32 pts |
| Aspire Lionel Wilson Oakland | Oakland Unified | 18% | 48% | +31 pts |
| Castlemont High Oakland | Oakland Unified | 3% | 32% | +28 pts |
| Mission High San Francisco | SFUSD | 27% | 55% | +27 pts |
| Oakland Charter High Oakland | Oakland Unified | 24% | 51% | +27 pts |
| Oakland International Oakland | Oakland Unified | 10% | 37% | +27 pts |
| Dozier-Libbey Medical Antioch | Antioch Unified | 17% | 43% | +26 pts |
| Oceana High Pacifica | Jefferson Union | 14% | 41% | +26 pts |
| SF International San Francisco | SFUSD | 24% | 49% | +25 pts |
If you’re looking at this list and noticing something — yes. Seven of the ten high schools are in Oakland or San Francisco. Most of them are schools that serve a high percentage of students from immigrant families, kids who are the first in their family to go to college, or English learners. A few are charters. One is a medical career academy in Antioch, another is in Pacifica.
What you do not see on this list: a single high school in Atherton, Palo Alto, Lafayette, Cupertino, or any other affluent zip code.
That’s not an accident.
Why the climbers look like this
Schools don’t suddenly become better academically in six short years. So what changed?
UC reviewers read applications differently than many parents realize. They don’t just look at GPA and test scores against a statewide bar. They read every application against the high school it came from. They look at what classes the school actually offered and how many graduating seniors usually go to college. They also review other factors like family income, whether a student is first gen and if English is the first language at home.
This is called holistic review, and after California banned race-based admissions in 1996 (Prop 209), UCs leaned harder into looking at every piece of context available to them.
So when a student graduates from MetWest in Oakland with a strong GPA, took the hardest classes their school offered, and is the first in their family applying to college, UC reads that very differently than the same GPA from an applicant coming from a high school where every senior takes 8 AP courses and both parents went to grad school. It’s not because the UC is grading on a curve, but they’re trying to figure out who actually maximized what they had access to.
The climbers list is what happens when UC’s contextual reading meets a generation of motivated students at schools that didn’t previously send a lot of seniors to a UC. The applicants didn’t change – UC’s understanding of them got sharper.
What this actually means
If your child goes to a high school like the ones on this climbers list, the takeaway is simple: their admit chances are real, and the school’s profile is part of what UC sees as a strength, not a weakness. Apply.
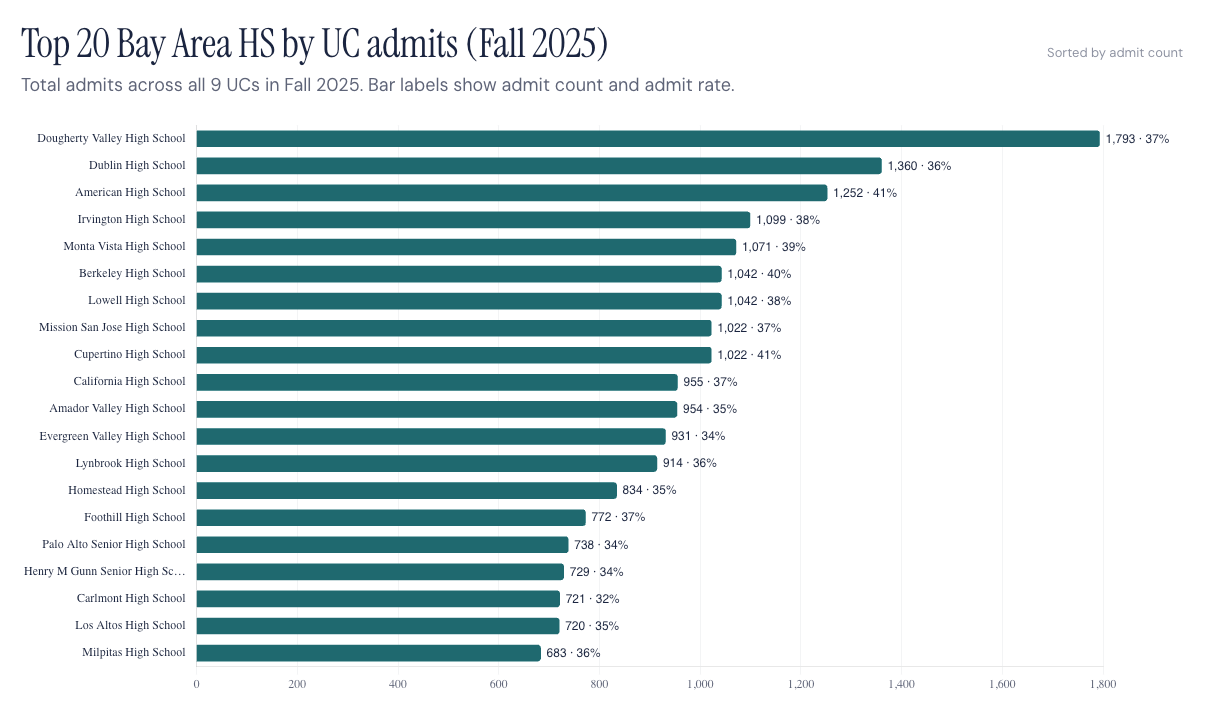
If your student goes to a highly competitive Bay Area school — Paly, Gunn, Mitty, M-A, Lowell, Lynbrook — the takeaway is different but just as important. These admit rates reflect how UC reads context, not just how strong the individual applicant is. These students should do the most they can with what their school offers, then write an application that shows who they are. UC will read it in context.
If they are somewhere in between — and most are — the data on the dashboard is worth a slow look. Find your school. Review the trend over six years and notice which UCs the school sends the most students to. That’s an extremely valuable starting point for building a college list.
A few honest cautions
These are average rates, not any specific student’s odds. UC reviewers read each application individually. A kid at the top of their class at any school we listed has very different chances than a kid in the middle of their class at the same school.
Climbing admit rates do not equal more total admits. Some schools climbed because their applicant pool got smaller (UC suppresses school-level data when fewer than 5 students apply, so we filter to 50+ apps). Mission High actually had nearly the same number of applicants in both years and almost double the admits, which is the cleanest version of this story. But others on the list could partially reflect changes in who chose to apply.
This is correlation, not magic. Going to MetWest does not mean your kid will get a 43 percent UC admit rate. It means kids at MetWest, on average, with their school context and applications, are getting in at that rate. Different kid, different application, different result.
Explore the full dataset
Every school, every UC campus, every year from 2019 to 2025 — filterable by county, city, and school — is in the dashboard page.
Want help making sense of this for your kid?
Ready to build your student’s plan? StrivePath offers personalized academic and college advising for Bay Area students from 7th grade through senior year. Book a free consultation with our team today.
👉 mystrivepath.com — StrivePath: Happier students. Less stressed families. Better admission outcomes.
Sources