UC Admit Rates: Peninsula and Palo Alto High Schools
Did you know? More Half Moon Bay seniors got into a UC last year than seniors at Palo Alto High and Gunn — at least when you compare the percentages. Half Moon Bay’s UC admit rate in the most recent published cycle: 41 percent. Palo Alto High: 34 percent. Gunn: 35 percent.
That’s the kind of number that makes a Paly or Gunn parent stop and wonder. So before we go any further: this is not bad news for Paly and Gunn families. We promise. By the end of this post you’ll see exactly why these numbers don’t necessarily mean what they look like. But as a parent you deserve the actual data, so here it is.
This is the first post in our six-week regional series. For the next six weeks we’re going to walk through one Bay Area region, review specific high schools, and show you what the UC numbers actually say.
Today’s region: the Peninsula and Palo Alto.
All 25 Peninsula and Palo Alto high schools, ranked
This is every public and charter high school we have UC data on, in San Mateo County plus Palo Alto Unified, ranked by their UC admit rate in the most recent published cycle (students who started in Fall 2025).
| School | District | UC Admit Rate | Applicants |
|---|---|---|---|
| Summit Preparatory Charter | Sequoia Union | 42% | 200 |
| Summit Public Schools Shasta | Jefferson Union | 41% | 338 |
| Half Moon Bay High | Cabrillo Unified | 41% | 341 |
| Oceana High (Pacifica) | Jefferson Union | 41% | 398 |
| Mills High (Millbrae) | San Mateo Union | 38% | 1,039 |
| Westmoor High (Daly City) | Jefferson Union | 38% | 516 |
| KIPP Esperanza High | Sequoia Union | 37% | 126 |
| Aragon High (San Mateo) | San Mateo Union | 36% | 1,555 |
| Capuchino High | San Mateo Union | 36% | 279 |
| Hillsdale High (San Mateo) | San Mateo Union | 35% | 869 |
| South San Francisco High | South SF Unified | 35% | 273 |
| East Palo Alto Academy | Sequoia Union | 35% | 63 |
| Design Tech High | San Mateo Union | 35% | 542 |
| Henry M. Gunn High | Palo Alto Unified | 35% | 2,116 |
| Palo Alto High | Palo Alto Unified | 34% | 2,163 |
| Woodside High | Sequoia Union | 34% | 829 |
| Jefferson High (Daly City) | Jefferson Union | 33% | 296 |
| Sequoia High (Redwood City) | Sequoia Union | 33% | 731 |
| El Camino High (South SF) | South SF Unified | 33% | 427 |
| San Mateo High | San Mateo Union | 33% | 1,020 |
| Burlingame High | San Mateo Union | 32% | 1,240 |
| Carlmont High (Belmont) | Sequoia Union | 32% | 2,286 |
| Menlo-Atherton High | Sequoia Union | 30% | 1,289 |
| Terra Nova High (Pacifica) | Jefferson Union | 29% | 225 |
| Tide Academy (Menlo Park) | Sequoia Union | 25% | 126 |
A few things probably jumped out:
- The big affluent-zip-code schools — Paly, Gunn, M-A, Carlmont — are in the middle to bottom of this list.
- The schools that serve more working-class and immigrant communities — Mills, Aragon, Hillsdale, South SF, Half Moon Bay — are at the top.
- Sequoia Union’s district average is 32 percent, the lowest of any Peninsula district, even though it includes M-A, Carlmont, Sequoia, and Woodside — schools with strong reputations.
This is real. It’s also not what most families assume. So let’s talk about why.
Why the “good schools” admit rates are lower
Here’s the thing that UCs do that many other colleges don’t: they read every application in context.
When a student applies to a UC from Paly or Gunn, the UC reviewer sees the school profile. They see that Paly offers 30 AP courses. They see that the average Paly senior took 4 to 6 APs. They see that nearly every senior at Paly is college-bound, that most have parents with graduate degrees, and that the school spends roughly twice the per-pupil amount that a Title I school spends. UC reviewers read the individual transcript against that environment.
When a student applies from Half Moon Bay High, the UC reviewer sees a school in a more rural, more mixed-income setting. Fewer AP courses available. A more diverse range of post-high-school plans. The evaluator reads the transcript against that unique environment too.
It’s not that the UC reviewer is grading Paly kids harder. It’s that they are asking: did this student maximize what was in front of them? At a school with 30 APs, “maximizing” means something different than at a school with 8. At a school where two-thirds of the parents have college degrees, “first generation” means something different than at a school where most kids are the first in their family to apply.
The bottom line: when you take a high-performing applicant pool from Paly (most kids meet the basic UC bar) and run them through holistic review where the school’s strong profile is “expected” rather than “exceptional,” the admit rate compresses. When you take a smaller, more variable applicant pool from Half Moon Bay where doing well stands out more relative to the school’s profile, the admit rate stretches.
This is not bad news for affluent-zip-code families. It’s actually how the UC evaluation has worked since 1996, when California banned race-based admissions and reviewers leaned harder into family income, school profile, and first-generation status as the things they could legally weigh.
What students are actually getting in?
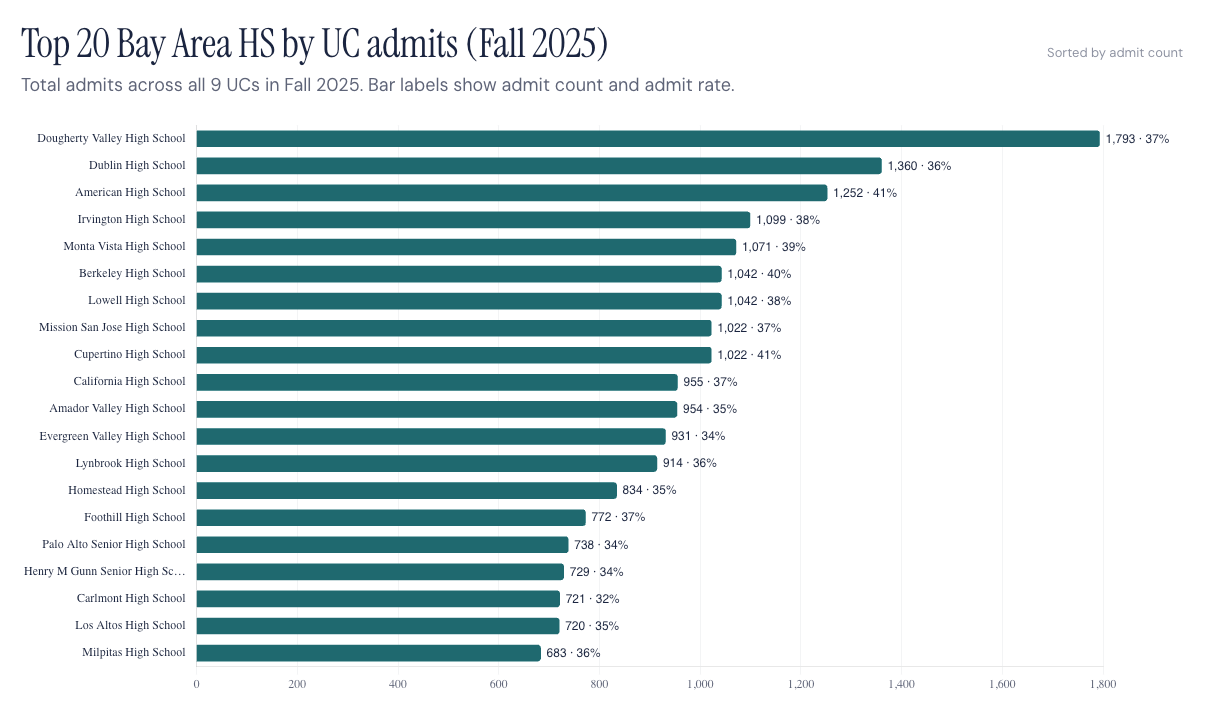
Here’s a number that does not show up on the rankings list. Paly sent 738 students to UC last year. Mills sent 396. In raw counts, Paly is sending more than twice as many kids to a UC as Mills. Gunn sent 729. Carlmont sent 721.
The big affluent-zip-code schools are still sending the most kids to a UC by far. Their admit rate looks lower because their applicant pool is much larger and so consistently strong that fewer of them stand out as exceptional in the UC’s reading. But the actual number of admits per school is still concentrated at the schools you’d expect.
Translated: if you’re a Paly or Gunn parent and your student is in the top half of the class, takes hard courses, and writes a thoughtful application, the math is still very much on their side. The rate is just compressed.
What this means for you
If your child goes to Paly, Gunn, Carlmont, M-A, Sequoia, or Burlingame: UC reviewers read each student against their school’s own profile. Top of the class with strong courses and a real application — they have great chances at multiple UCs. Don’t let the school’s average rate make you panic, and don’t let it make you over-apply to safeties.
If your child goes to Mills, Aragon, Hillsdale, South SF, Half Moon Bay, Oceana, Westmoor, or one of the higher-rate schools: the data shows your school’s students are getting admitted at strong rates. UC reviewers will read their profile in the context of your school. Don’t undersell what’s possible.
If your child goes to Tide, Terra Nova, Jefferson, or Menlo-Atherton: the rates here vary for different reasons. M-A draws from East Palo Alto and Atherton — wildly different profiles within one school, which compresses the average. Tide and Terra Nova are smaller schools where the data is less stable year to year. Look at your student’s individual profile, not the school average.
For everyone: spend ten minutes with your student’s high school in our dashboard. Look at the year-over-year trend. Look at which UCs your school sends the most kids to. That’s a much better list-building starting point than national rankings.
A few honest cautions
These are average rates, not your student’s odds. UCs read each application individually. The same school’s top-quarter and bottom-quarter students have very different admit chances.
Private schools are mostly not in this data. UCs suppress school-level data when fewer than 5 students apply, which excludes most private schools from this dataset. We’re working on a separate post for Peninsula private schools.
Year ranges matter. The numbers here are for the most recent published cycle, students who started at a UC in the Fall of 2025. UCs publish data with a 12-month lag, so this is the freshest school-level information available.
Smaller schools have noisier data. Tide Academy (126 applicants) has more year-to-year volatility than Carlmont (2,286 applicants). Treat the smaller-school rates as approximations.
Coming next Thursday
Mountain View, Sunnyvale, and Los Altos. Same approach: every public and charter high school, every UC, with the warm explainer for what the numbers actually mean.
Explore the full dataset
Every school, every UC campus, every year from 2019 to 2025 — filterable by county, city, and school — is in the dashboard page.
Want help making sense of this for your kid?
Ready to build your student’s plan? StrivePath offers personalized academic and college advising for Bay Area students from 7th grade through senior year. Book a free consultation with our team today.
👉 mystrivepath.com — StrivePath: Happier students. Less stressed families. Better admission outcomes.
Sources