UC Admit Rates: San Jose High Schools
Did you know? The San Jose public high schools with the highest UC admit rates last year are not the ones parents often move across neighborhoods to attend.
Mount Pleasant High's UC admit rate in the most recent published cycle: 48%. Andrew Hill: 46%. Yerba Buena: 46%. Overfelt: 44%.
And the schools many San Jose parents think of first? Leland: 37%. Willow Glen: 38%. Pioneer: 35%. Branham: 35%. Evergreen Valley: 34%.
Take a moment with that. Mount Pleasant, Andrew Hill, Yerba Buena, and Overfelt — all East Side Union schools, all in parts of San Jose that don't come up in competitive parent conversations — out-admitted Leland, Willow Glen, and Evergreen Valley by a wide margin. If you're a parent in Blossom Valley, Silver Creek, or Almaden, you've probably never had a neighbor mention Mount Pleasant's UC admit rate at a school event. But the data is the data.
This is not bad news for San Jose Unified or Campbell Union families. We promise. By the end of this post you'll see exactly why these numbers don't mean what they look like at first glance — and why the East Side numbers come with an important asterisk too. You're a parent and you deserve the actual numbers, so here they are.
This is the fifth post in our regional series. Every week we're walking through one Bay Area region, naming the public and charter high schools, and showing you what the UC numbers actually say. Today: San Jose — the East Side Union, San Jose Unified, Campbell Union, and Morgan Hill Unified schools that make up one of the largest public school ecosystems in the Bay Area.
One note before the table: this data covers public and charter high schools only. Bellarmine College Preparatory, Archbishop Mitty, Valley Christian High, Notre Dame San Jose, and Presentation High are all excluded. UC suppresses school-level data when fewer than five students apply from a given school at a given campus, and that effectively removes most private schools from the published dataset. They send real kids to UC, but we can't compare them here.
Twenty San Jose public high schools, ranked
This is the most relevant set of San Jose public high schools that we have UC data on, ranked by UC admit rate in the most recent published cycle (Fall 2025 — students who started college this past fall).
| School | District | City | UC Admit Rate | Applicants |
|---|---|---|---|---|
| Mount Pleasant High | East Side Union | San Jose | 48% | 198 |
| Andrew P. Hill High | East Side Union | San Jose | 46% | 250 |
| Yerba Buena High | East Side Union | San Jose | 46% | 648 |
| William C. Overfelt High | East Side Union | San Jose | 44% | 225 |
| Live Oak High | Morgan Hill Unified | Morgan Hill | 39% | 279 |
| Independence High | East Side Union | San Jose | 39% | 615 |
| Del Mar High | Campbell Union | San Jose | 38% | 223 |
| Willow Glen High | San Jose Unified | San Jose | 38% | 599 |
| Santa Teresa High | East Side Union | San Jose | 38% | 880 |
| Leland High | San Jose Unified | San Jose | 37% | 1,640 |
| Abraham Lincoln High | San Jose Unified | San Jose | 37% | 382 |
| Ann Sobrato High | Morgan Hill Unified | Morgan Hill | 37% | 697 |
| Oak Grove High | East Side Union | San Jose | 36% | 352 |
| Silver Creek High | East Side Union | San Jose | 36% | 1,079 |
| Pioneer High | San Jose Unified | San Jose | 35% | 799 |
| Leigh High | Campbell Union | San Jose | 35% | 1,554 |
| Branham High | Campbell Union | San Jose | 35% | 1,109 |
| Piedmont Hills High | East Side Union | San Jose | 35% | 1,236 |
| Evergreen Valley High | East Side Union | San Jose | 34% | 2,735 |
| Westmont High | Campbell Union | Campbell | 34% | 867 |
A few things probably jumped out:
- The top four spots all belong to East Side Union District schools — Mount Pleasant, Andrew Hill, Yerba Buena, and Overfelt — none of which make the list of schools most San Jose parents would name as "top" UC pipelines.
- Evergreen Valley High, with 2,735 applicants — one of the largest UC applicant pools among San Jose schools — is at the bottom of this list at 34 percent. Large, competitive pools can compress an admit rate even when the school sends hundreds of kids to UC in raw numbers.
- Leland High and Willow Glen High sit in the middle of the pack, at 37 and 38 percent respectively. These are the schools many San Jose families prioritize for college-bound kids — and they're still sending strong numbers to UC, just not topping the rate list.
- The Campbell Union schools — Del Mar, Leigh, Branham, Westmont — cluster between 34 and 38 percent. Leigh High in particular, with 1,554 applicants, is a bigger UC pipeline than many parents realize.
- Morgan Hill Unified's two schools, Live Oak and Ann Sobrato, both land solidly in the upper-middle tier at 39 and 37 percent.
This is real. And the East Side numbers need a careful read. So let's unpack both.
Why the "good schools" admit rates are lower — and why the East Side numbers aren't simple
Here's the thing UC does that most reviewers don't: they read every application in context.
When a student applies to a UC from Leland High or Evergreen Valley, the UC application reviewer sees the school profile. They see strong AP offerings, a large college-bound senior class, and an applicant pool full of students who have been targeting UC systematically. When many students from the same school are applying with similar transcripts, strong AP loads, and comparable extracurriculars, the pool becomes more competitive within itself — and the admit rate compresses as a result.
When a student applies from Mount Pleasant or Andrew Hill, UC sees a different school profile. These are schools with a genuinely broader range of family backgrounds, more first-generation college students, and a smaller share of the senior class applying to UCs in any given year. When a strong student applies from one of these schools, they stand out more clearly against the profile for that school. UC has leaned into family income, school context, and first-generation status since 1996 — that's not a loophole, it's how holistic review has worked for decades.
Now for the honest asterisk. Mount Pleasant had 198 applicants in this cycle. Andrew Hill had 250. Overfelt had 225. These are small pools — small enough that the admit rate can swing meaningfully from one year to the next if even twenty or thirty students' outcomes shift. A 48 percent rate at a school with 198 applicants is real, but it's also less stable than a 37 percent rate at Leland with 1,640 applicants. If you are a Mount Pleasant or Overfelt family reading this, the number is encouraging and worth knowing — but it's an approximation of a trend, not a precise annual guarantee.
Yerba Buena, with 648 applicants, is the most stable of the top four East Side schools. Santa Teresa High, also East Side Union with 880 applicants, comes in at 38 percent — and that's a rate you can rely on more year to year.
This is not bad news for Leland and Evergreen Valley families. It's actually the expected pattern given how UC holistic review works. Schools that send 1,500 or 2,700 applicants to UC every year, with pools that are uniformly strong, will see their admit rates compress.
What about kids actually getting in?
Here's the number that doesn't show up on the rankings list. Evergreen Valley High sent roughly 932 kids to UC last year. Leland sent roughly 606. Leigh High sent about 543. Branham sent about 387. Silver Creek sent about 385.
In raw counts, Evergreen Valley is sending more kids to UC per year than any other school on this list — nearly five times as many as Mount Pleasant. The East Side schools at the top of the rate list are sending far smaller absolute numbers: Mount Pleasant about 95 kids, Andrew Hill about 115, Overfelt about 99.
The rate tells you one story. The raw count tells you another. Both are true, and both matter — depending on whether you're trying to understand what the UC system looks like for a school community, or what your individual kid's chances might be.
What this means for your student
If your kid goes to Leland High, Willow Glen High, Abraham Lincoln High, or Pioneer High (San Jose Unified): the admit rate at your school is not the student’s individual admit rate. The 35-to-38 percent rates reflect large, competitive pools — not a ceiling. A top-half student with strong courses and a thoughtful application has very different odds than the school average suggests. San Jose Unified sends hundreds of kids to UC every year.
If your kid goes to Leigh High, Branham High, Del Mar High, or Westmont High (Campbell Union): these four schools combine for over 4,000 applicants to UC each year at solid rates in the 34-to-38 percent range. Don't let the smaller name footprint of Campbell Union schools fool you — these are real, active UC pipelines.
If your kid goes to Santa Teresa High, Silver Creek High, Piedmont Hills High, Oak Grove High, or Evergreen Valley High (East Side Union's larger schools): rates of 34-38 percent are right in line with San Jose Unified. Evergreen Valley in particular sends the most students to a UC of any school on this list in raw count. These schools deserve more credit in the college-planning conversation than they typically get.
If your kid goes to Mount Pleasant High, Andrew Hill, Yerba Buena, or Overfelt High: the rates are genuinely encouraging, and UC's holistic review is working as intended for these schools. Keep in mind the small-pool caveat — these rates can move more year to year than the big schools'. Being a strong student from one of these schools is a real signal UC pays attention to. Focus on your kid's individual profile and application.
If your kid goes to Live Oak High or Ann Sobrato High in Morgan Hill: both schools are sending students to UC at solid rates — 39 and 37 percent. Morgan Hill Unified doesn't always come up in Bay Area college conversations, but these are healthy pipelines.
For everyone: spend ten minutes with your actual school in the UC dashboard. Look at the year-over-year trend and which specific UC campuses your school sends the most students to. That's a much better list-building starting point than school reputation or which neighborhood parents say is "best for college."
A few honest cautions
These are average rates, not your student's odds. UC reads each application individually. The same school's top-quarter and bottom-quarter students have very different admit chances. A 37 percent school-wide rate doesn't tell you much about a specific applicant.
Small schools have noisier data. Mount Pleasant (198 applicants), Andrew Hill (250), Del Mar (223), and Overfelt (225) have enough year-to-year variability that you should treat their rates as directional, not precise. Live Oak (279) and Oak Grove (352) are also on the smaller side. Yerba Buena, Santa Teresa, and the other larger East Side schools are more stable.
Private schools are not in this data. Bellarmine College Preparatory, Archbishop Mitty, Valley Christian High, Notre Dame San Jose, and Presentation High are all excluded. We're planning a separate post for Bay Area private schools.
Year ranges matter. The numbers here are for the most recent published cycle, students who started at UC in fall 2025. UC publishes this data with about a 12-month lag, so this is the freshest school-level data available.
The range across San Jose schools is real, but tighter than it looks. From 34 percent (Evergreen Valley, Westmont) to 48 percent (Mount Pleasant) is a 14-point spread — but most of the middle of the list lives between 34 and 39 percent. The headline differences are driven partly by pool size and composition, not just school quality.
Coming next Thursday
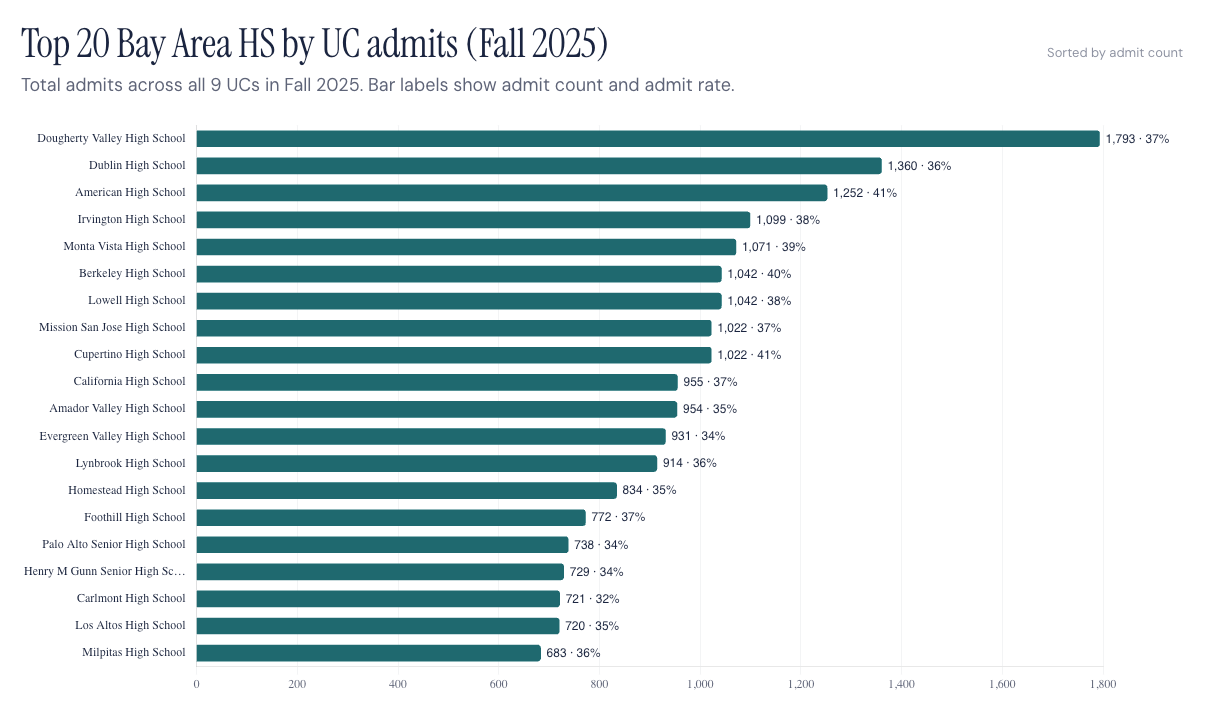
Tri-Valley. Granada, California High, Livermore, Dougherty Valley, Foothill, Dublin, Amador Valley, Monte Vista, and San Ramon Valley. Same approach: every public high school, every UC, with the warm explainer for what the numbers actually mean.
Want help making sense of this for your kid?
Ready to build your student's plan? StrivePath offers personalized academic and college advising for Bay Area students from 7th grade through senior year. Book a free consultation with our team today.
👉
mystrivepath.com — StrivePath: Happier students. Less stressed families. Better admission outcomes.
Sources
- UC Information Center — admissions by source school
- UCOP Fall 2025 Admissions Summary (PDF)
- UC Eligibility in the Local Context (ELC)
- California Department of Education DataQuest